A considerable amount of power transformers in operation do not own Original Equipment Manufacturer (OEM) technical support. It is desirable and feasible to obtain the related design information by interpreting the Frequency Response Analysis (FRA) measurement data. Winding type is one of those wanted design data which could be identified, for the purpose to help manage transformer assets.
FRA is effective to detect the mechanical integrity of transformer windings. A low voltage sinewave signal, over a large range of frequency, at a frequency is injected at one end and a signal is received at the other end of winding. FRA trace consists of the magnitude ratio and phase difference between the two signals.
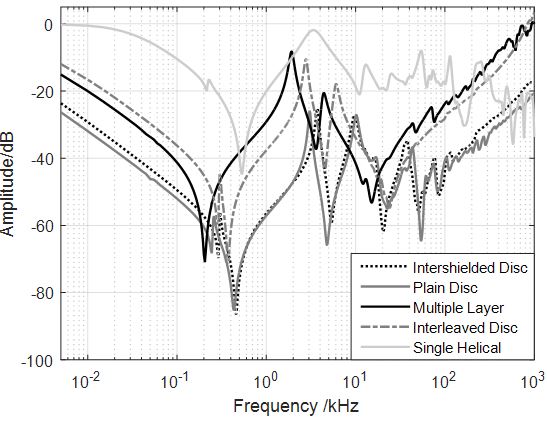
For 400/275 auto transformers without winding taps, the frequency range, empirically from 20 kHz to 1000 kHz, is controlled by the winding properties. Some typical FRA magnitude traces of different winding types are illustrated in Fig.1. In the concerned frequency region, The FRA magnitude has a rising trend with obvious fluctuations for the multiple layer winding. Interleaved disc winding has generally a larger series capacitance than multiple layer winding and consequently a smoother increasing tendency. Plain disc winding has camel humps, with either steady flat or rising trend. The FRA characteristic of Intershielded Disc winding is not unique; it looks like Plain Disc winding type. As for single helical winding, it has higher magnitude in most part of the frequency range low than 1000 kHz compared with other winding types
Supervised machine learning method Support Vector Machine (SVM) builds a model according to the FRA data of known winding types, and this model can be used to predict the unknown FRA trace’ winding type.
A Binary SVM classifier finds a hyperplane which optimally separates two categories of data, and the type of new data is decided by its location to the hyperplane. This margin from each type of data to the hyperplane is to be maximized, which is a convex quadratic programming problem. Actually, a multiclass classification problem could be reduced into multiple binary classification problems. One-versus-one strategy is adopted in this study, which means that for one binary classifier, a decision can be made between every two classes, to which a feature belongs. The new data is assigned according to the type which wins most votes.
Though standardization increases the difficulty of classification, it is still applied on the FRA data in that the classifier focuses more on the shape of the FRA trace, which is more of the interest for this technique to apply itself to all transformers with various voltage and power ratings.
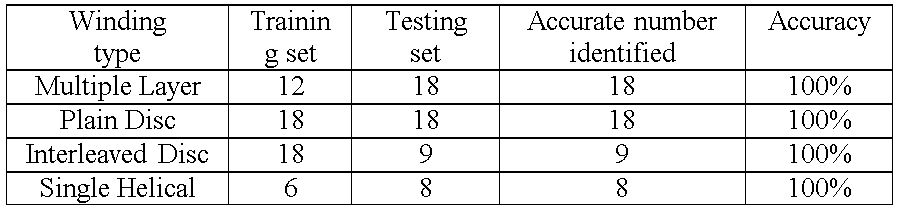
Altogether 54 traces with known winding type labels are used to build the multiclass SVM model. The prediction results of the rest 53 tested traces data are presented in TABLE I. All of the tested traces are classified into the right type. This is an encouraging result as it can be seen as a proof that SVM, is relying on the overall frequency features, not only the magnitude trend.
Unsupervised machine learning method Hierarchical clustering groups FRA traces with similar distance, with the aid of Dynamic Time Warping (DTW) technique.
For a given group of observations, each observation is initially treated as a separate cluster, and the algorithm repeatedly identifies the closest two clusters and merges them, until all the clusters are merged into one cluster. In fact, the distance between two observations reflects the similarity between them. Euclidean Distance is one of the most commonly used distance types and is used here.
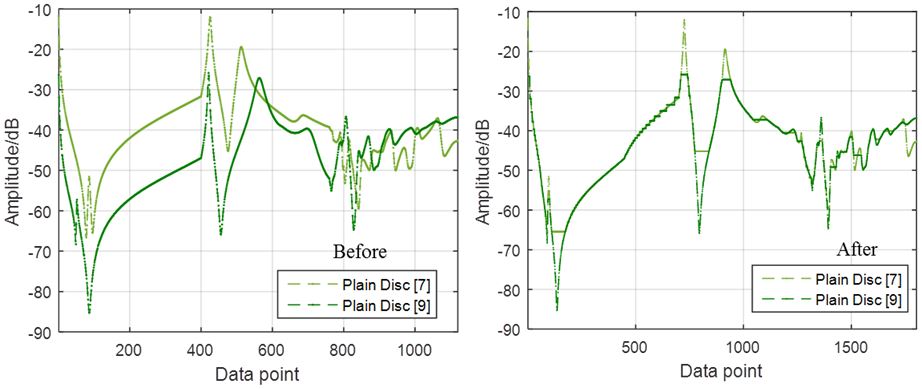
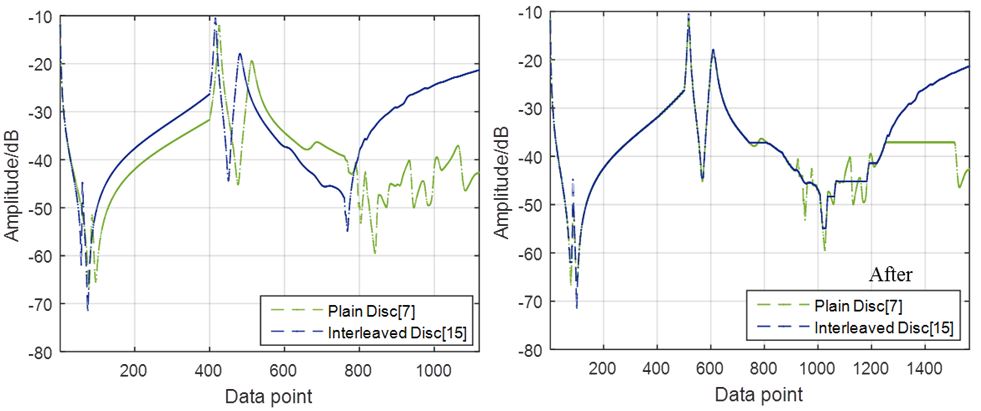
DTW is one of the algorithms for measuring similarity between two temporal sequences, which may vary in speed. It can be used to identify same characteristics before and after scaling. DTW horizontally scales two traces to align them to each other. Among all the possible paths, it chooses the one which has smallest moving distance. Horizontal points will be inserted to compensate the part where the height is not aligned.
Two examples are given in Fig.2 and Fig.3 before and after DTW process.
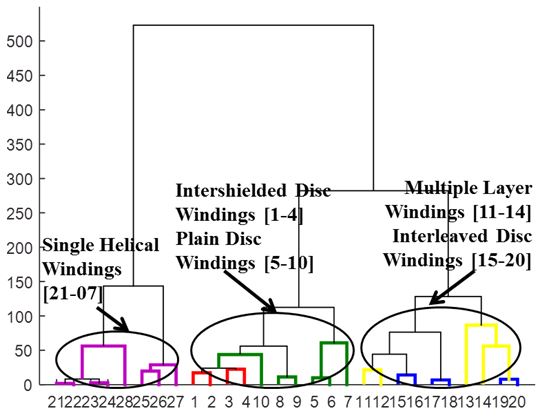
The Euclidean Distance should be calculated after the traces being processed by DTW. In Fig.4, it can be seen that all traces are divided into three distinctive groups; one group contains all the 8 Single Helical windings and the others are separated into two groups, one with low capacitance (Plain Disc winding and Intershielded Disc winding) and the other with high capacitance (Multiple Layer winding and Interleaved Disc winding).
Once a method which can give a clear clustering result is developed, winding type recognition could be achieved by clustering of mixed known and known windings. The locations of known windings indicate the corresponding classification of unknown windings.
Author: Xiazhou Mao – The University of Manchester
References:
- Mao, Z.D. Wang P. Jarman and A. Roxborough “Winding Type Recognition through Supervised Machine Learning using Frequency Response Analysis (FRA) Data”, 2019 ICEMPE.
- Mao, Z.D. Wang P. Jarman, A. Fieldsend-Roxborough, and G. Wilson, “Applying Unsupervised Machine Learning Method on Fra Data to Classify Winding Types”, the 21st Int. Symp. on High Voltage Engineering, Budapest, 2019.