Introduction
The failure of transformers can result in safety issues and economic losses. Although FRA is widely used to detect mechanical winding deformation, the success of this technique lies in the correct interpretation of the FRA plot and up to now there is no IEC/IEEE standard for FRA interpretation although a CIGRE WG A2.53 working group is currently working towards producing a technical brochure on this respect.
Most researchers investigate the FRA characteristics in the high frequency region through experiments and/or simulation due to the FRA characteristics in this region is more winding structure related [1-6], nevertheless, the low frequency FRA feature, in the frequencies generally up to 2 kHz, associated with global parameters of a transformer, is the “grey” area where not much research attention has been paid. A measurement based approach is proposed in [7] proposed to establish a low frequency transformer model for FRA simulation studies, and the simulation results are validated through the comparison with measurement results. In [8] a 400/275/13 kV auto-transformer is used as an example to build a low frequency first order transformer model and sensitivity studies are conducted on the influencing electrical factors on the low frequency anti-resonances and resonances. This paper is a sister paper to [8] which continue to study and discuss how to interpret the first anti-resonance of FRA responses.
Simulation Model
A typical UK three-phase 1000MVA 400/275/13 kV auto-transformer is modelled.
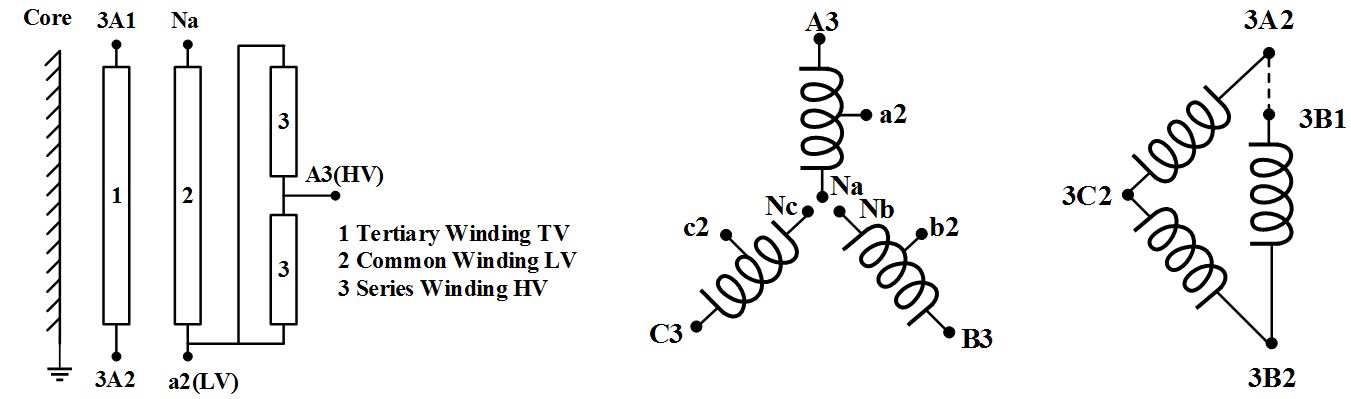
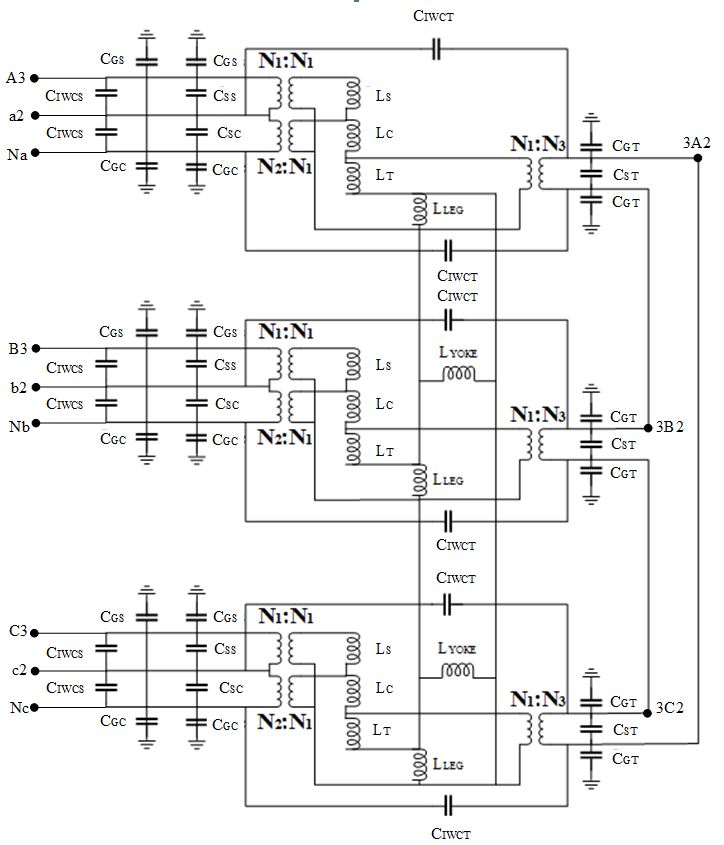
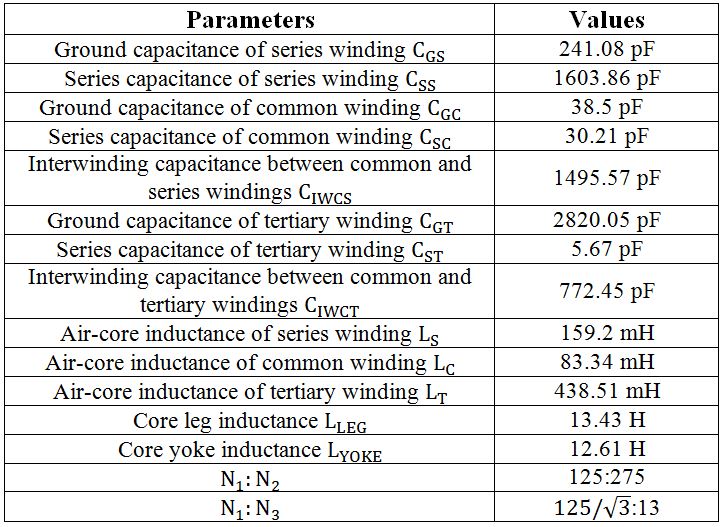
The model involves both inductive and capacitive elements, and the values of all the elements are calculated based on winding geometry, the explanation and values of elements are listed below:
Simualtion Validation
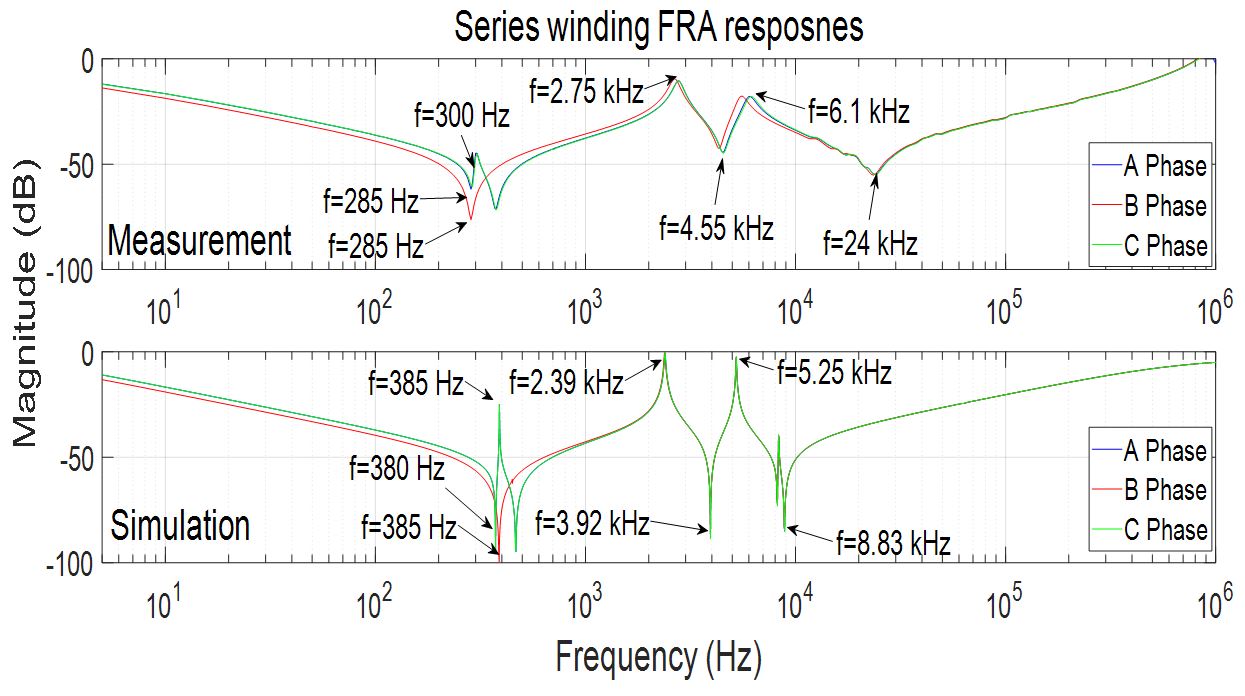
The frequencies of anti-resonances and resonances of both measurement and simulation results are presented on the FRA responses. It can be concluded that the model can produce reasonable FRA simulation result in the low frequency region, the anti-resonances and a double-peak feature can be reflected, while in the high frequency region, the model is over simple that cannot represent the transformer accurately.
Interpretation of the 1st anti-resonance
For FRA end to end open circuit measurement connection, the transformer winding can be regarded as a purely inductance with a 50 Ω in series connection in the low frequency region where the magnitude falls in 20 dB per decade, therefore through the FRA low frequency data, an equivalent core inductance value can be calculated.
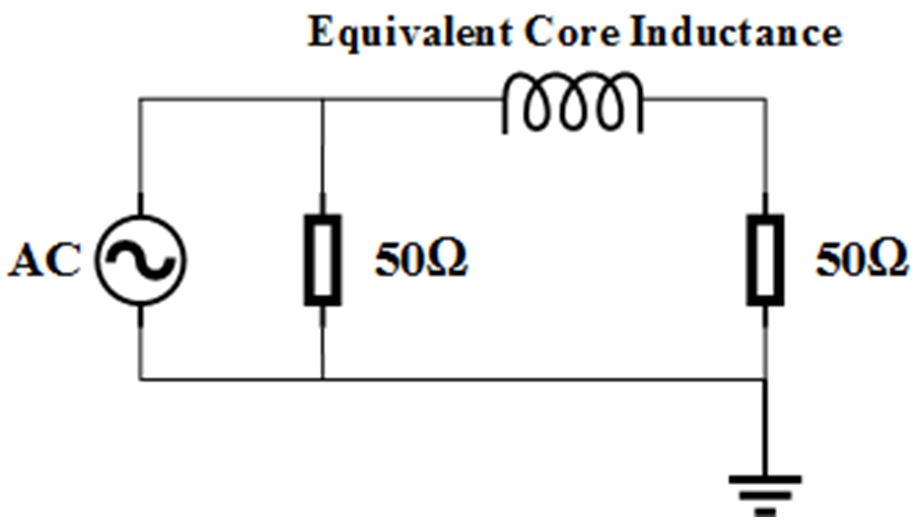
In addition, the 1st anti-resonance of B phase winding FRA responses is created by the resonant coupling between the equivalent core inductance L and the equivalent capacitance Ce , consequently Ce can be calculated by:

Ce is the equivalent capacitance seen from the tested winding, and also believed as the combination of winding capacitances.
Composition of equivalent winding capacitance seen at winding terminal
To quantify the influence of winding capacitances on the first anti-resonance, the relationship between Ce and winding capacitances is required. In this section, sensitivity studies on the contribution from individual winding capacitance to Ce is implemented.
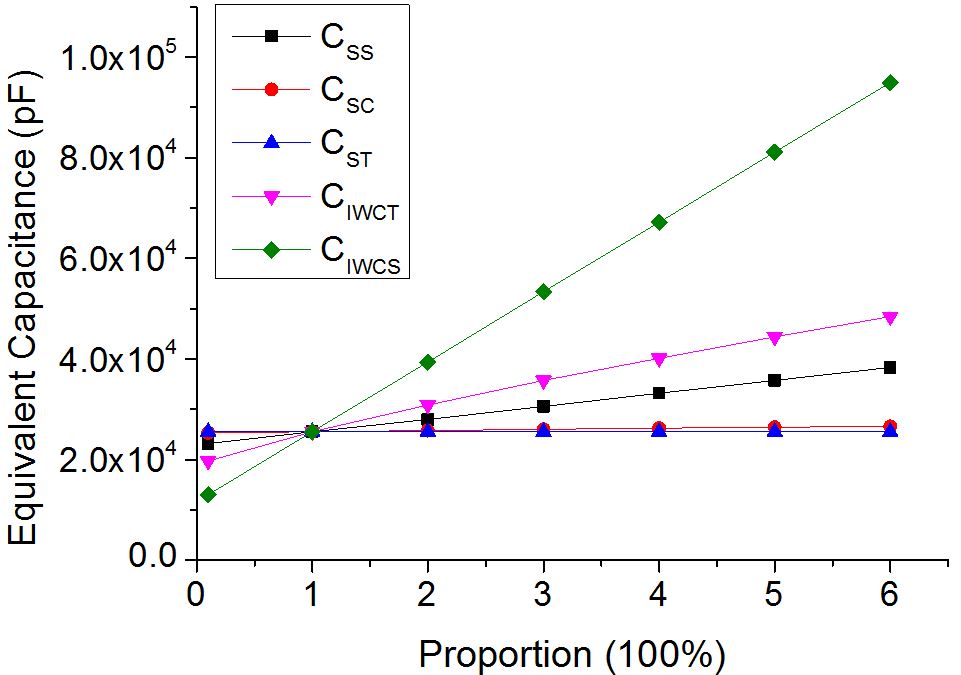
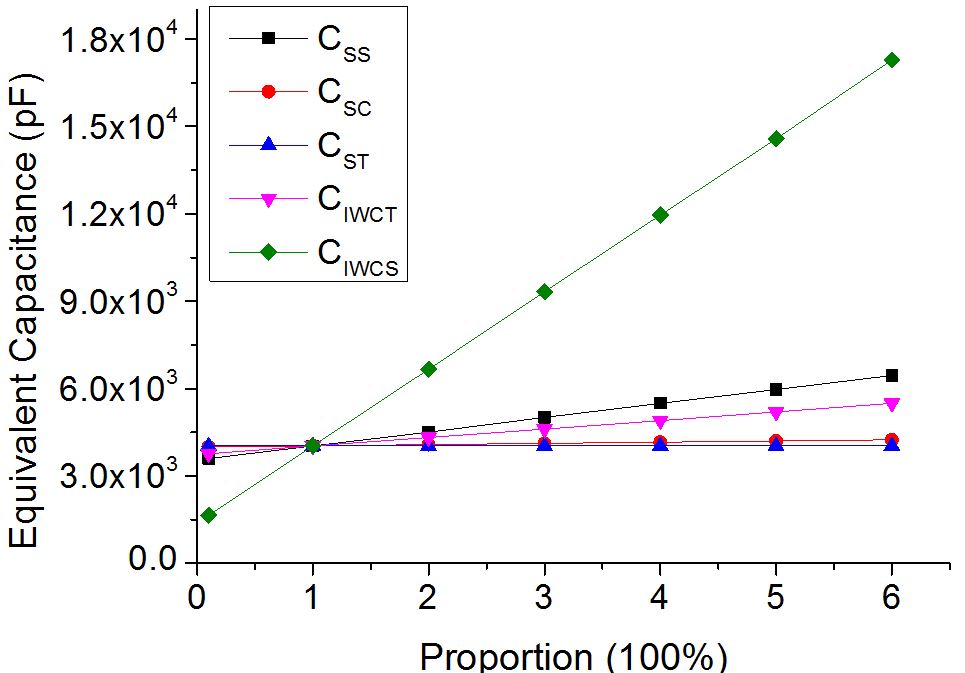
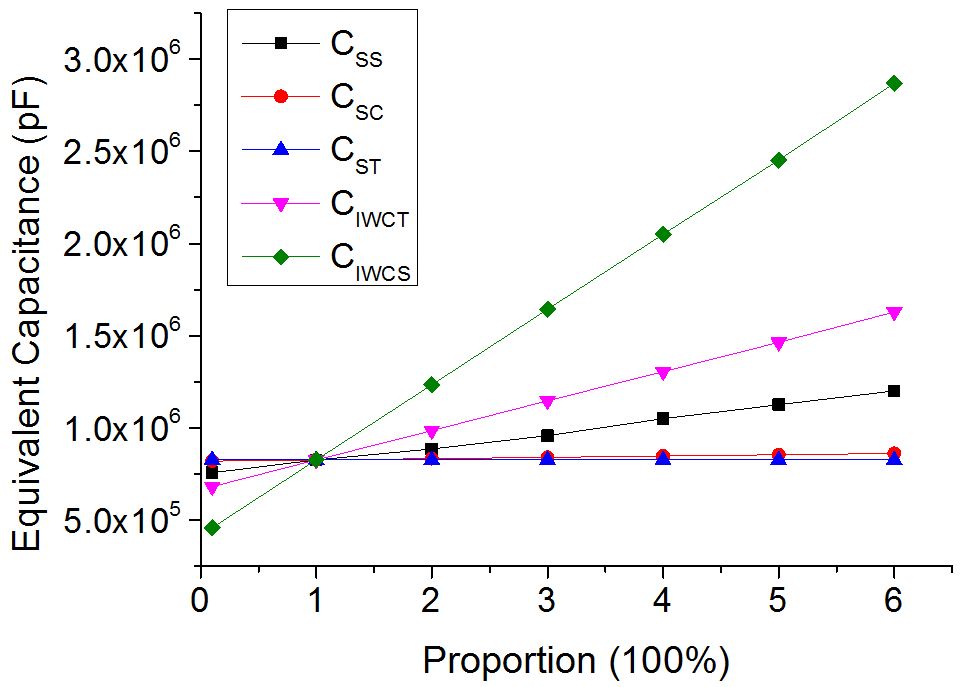
It is found that no matter which winding is tested, the winding series capacitances and interwinding capacitances always have a linear relationship with Ce, and CIWCS contributes most to Ce among all the capacitive elements.
For series and tertiary windings, CIWCT takes the secondary status. For common winding, CSS ranks only second to CIWCS, on the other hand, the series capacitances of common and tertiary windings have minor contribution to Ce because they are too small when compare to other capacitive elements.
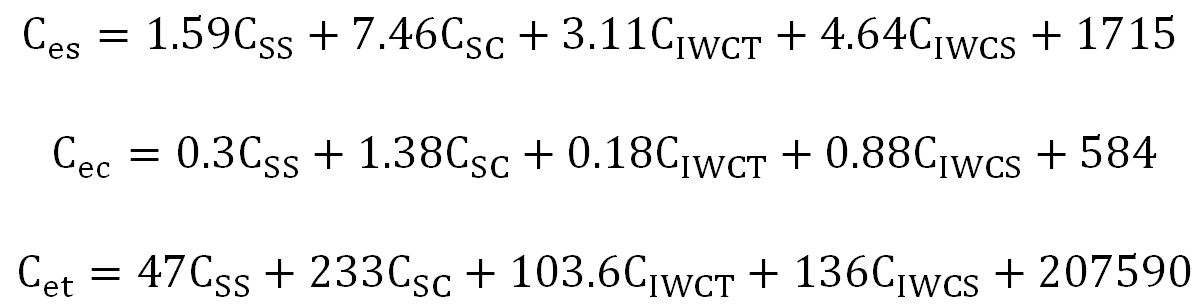
Through the linear regression method, the expressions of equivalent capacitance Ce for B phase windings are calculated) respectively, the unit for the variables in three equations is pF, CST is neglected in the equations since it is so small that even 600% CST can hardly shift the first anti-resonance in any sensitivity study case (frequency resolution is 1 Hz), in addition, for the constants (1715, 584 and 207590 pF) in the equations, it is believed that they represent the effect of winding ground capacitances.
With the relationship developed between Ce and other geometric winding capacitances, it is now feasible to demonstrate that the frequency of the first anti-resonance can be represented by electrical parameters in the model.
It can be concluded that the 1st anti-resonance of transformer B phase winding FRA response is created by the resonant coupling between the equivalent core inductance and equivalent winding capacitance, the equivalent core inductance can be calculated based on FRA low frequency data, and the equivalent winding capacitance is the linear composition of winding series capacitances and inter-winding capacitances.
Author: Bozhi Cheng – The University of Manchester
Reference
[1] J. F. Jiang, L. J. Zhou, S. B. Gao, W. Li, and D. Y. Wang, “Frequency Response Features of Axial Displacement Winding Faults in Autotransformers With Split Windings,”, IEEE Transactions on Power Delivery, vol. 33, no. 4, pp. 1699-1706, Aug 2018.
[2] M. H. Samimi, S. Tenbohlen, A. A. S. Akmal, and H. Mohseni, “Dismissing Uncertainties in the FRA Interpretation,” IEEE Transactions on Power Delivery, vol. 33, no. 4, pp. 2041-2043, Aug 2018.
[3] Z. D. Wang, J. Li, and D. M. Sofian, “Interpretation of Transformer FRA Responses-Part I: Influence of Winding Structure,” IEEE Transactions on Power Delivery, vol. 24, no. 2, pp. 703-710, Apr 2009.
[4] D. M. Sofian, Z. D. Wang, and J. Li, “Interpretation of Transformer FRA Responses – Part II: Influence of Transformer Structure,” IEEE Transactions on Power Delivery, vol. 25, no. 4, pp. 2582-2589, Oct 2010.
[5] N. Hashemnia, A. Abu-Siada, and S. Islam, “Improved Power Transformer Winding Fault Detection using FRA Diagnostics – Part 1: Axial Displacement Simulation,” IEEE Transactions on Dielectrics and Electrical Insulation, vol. 22, no. 1, pp. 556-563, Feb 2015.
[6] N. Hashemnia, A. Abu-Siada, and S. Islam, “Improved Power Transformer Winding Fault Detection using FRA Diagnostics – Part 2: Radial Deformation Simulation,” IEEE Transactions on Dielectrics and Electrical Insulation, vol. 22, no. 1, pp. 564-570, Feb 2015.
[7] D. A. K. Pham, T. M. T. Pham, H. Borsi, and E. Gockenbach, “A new method for purposes of failure diagnostics and FRA interpretation applicable to power transformers,” IEEE Transactions on Dielectrics and Electrical Insulation, vol. 20, no. 6, pp. 2026-2034, 2013.
[8] B. Cheng, P. Crossley, Z. D. Wang, P. Jarman and A. Roxborough, “Interpretation of FRA Results through Low Frequency Transformer Modelling,” IEEE 2nd Internation Conference on Electrical Materials and Power Equipment, Guangzhou, China, Apr 2019.