The prebreakdown and breakdown phenomenon in liquids is termed as ‘Streamer’. To better understand the mechanism of liquid breakdown, we need to have deep insights into the streamer process, which requires the visual acquisition of streamer developments. Streamer is a fast transient process on µs time scale that results in challenges on the visualisation in the early times. Thanks to the rapid development of high speed imaging techniques in past decades, photographing the streamer becomes within the bounds of possibility with much improved imaging quality.
To capture streamer images, it is essential to adopt effective, sensitive and precise optical methods to visualise the minor changes in the media. This article will give a brief introduction to the most common two techniques, shadowgraph and Schlieren, and will compare the advantages and the disadvantages in visualising streamers.
Milestones of Shadowgraph and Schlieren Development
The very first shadowgraph sketch was dated back to 1780 by a Swiss physicist Jean Paul Marat, who revealed the plumes ascending from a burning candle. For years, the invention of Schlieren method was accredited to the German physicist August Toepler, who used the method to visualise inhomogeneities in media and gave birth to its German name meaning ‘streak’ in English in 1864. Nonetheless, the appearances of these two methods are believed to come into being even much earlier. The German optician Johann Wiesel was believed to have built up the instruments which were regarded as the prototype of shadowgraph method. It was proven that the British physicist Robert Hooke had already governed the Schlieren method in 1672. Modern shadowgraph and Schlieren methods have evolved with different derivatives with higher complexity and accuracy thanks to optical developments, e.g. laser Schlieren, rainbow Schlieren, and background oriented Schlieren. It was until early 1960s when Schlieren method was firstly introduced to study the prebreakdown phenomenon in insulation liquids [1,2].
Working PrinciplesnAll optical visualisation methods rely on visualising the minor density (refractive index) changes in the media. When light is travelling through a medium, it refracts at the inhomogeneities.
Any medium is optically characterised by the refractive index:
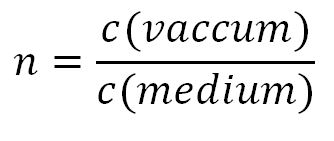
Where is refractive index, is the light speed in vacuum and is the light speed in the medium.
The amount of change in the light refraction through an interface where variations in refractive index happen is determined by the gradient of the refractive index ∂n/∂z, where Z designates the light travelling direction.
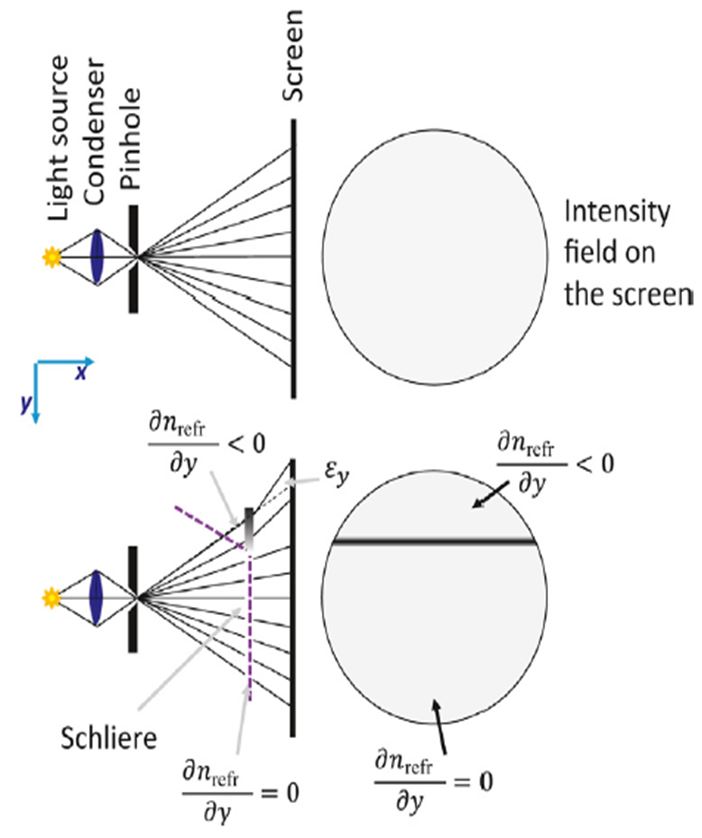
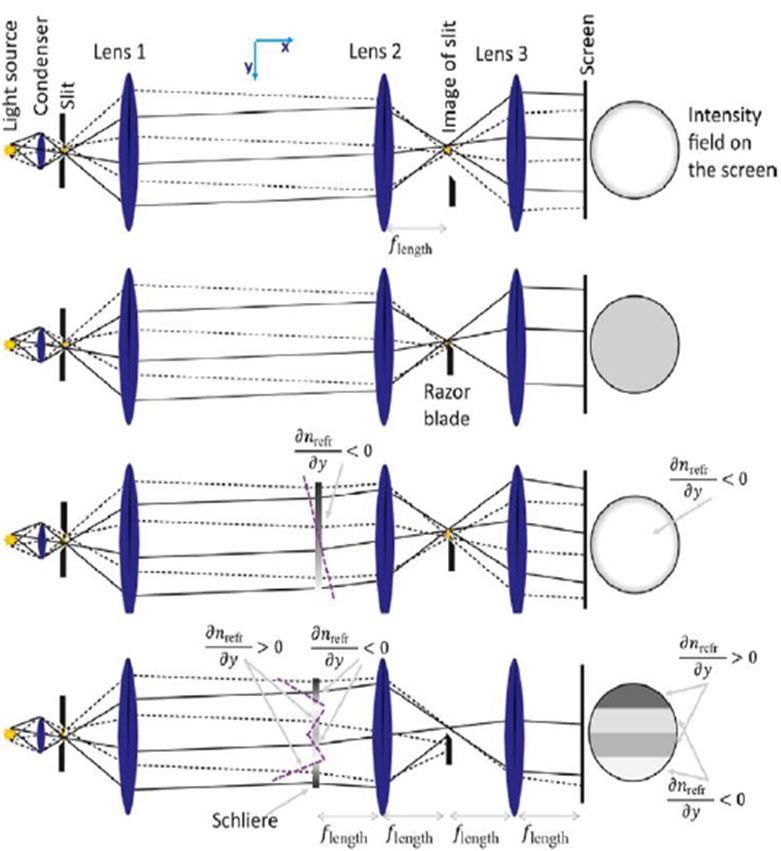
The principle of shadowgraph is straightforward. The light passing through a density disturbance with positive or negative gradient in refractive index will be bent either upwards or downwards, leaving a shadow area at the original projected position on the screen. The principle of Schlieren is a bit more complicated, involving processes of transforming the diverging lights into paralleled lights, focusing the paralleled lights and, most importantly, the application of a knife edge to cut off half of the light at the focal point in front of the screen. In this way, an intermediate grayscale level on the screen is created as the background. The partially upwards or downwards deflections of the lights will be more unblocked or blocked by the cutting off of the knife edge, which gives variations on the grayscale levels on the screen. In other words, Schlieren methods can reflect the magnitude in the change of the gradient of refractive index. To briefly sum up, Schlieren method has higher sensitivity but is harder to implement in practice.
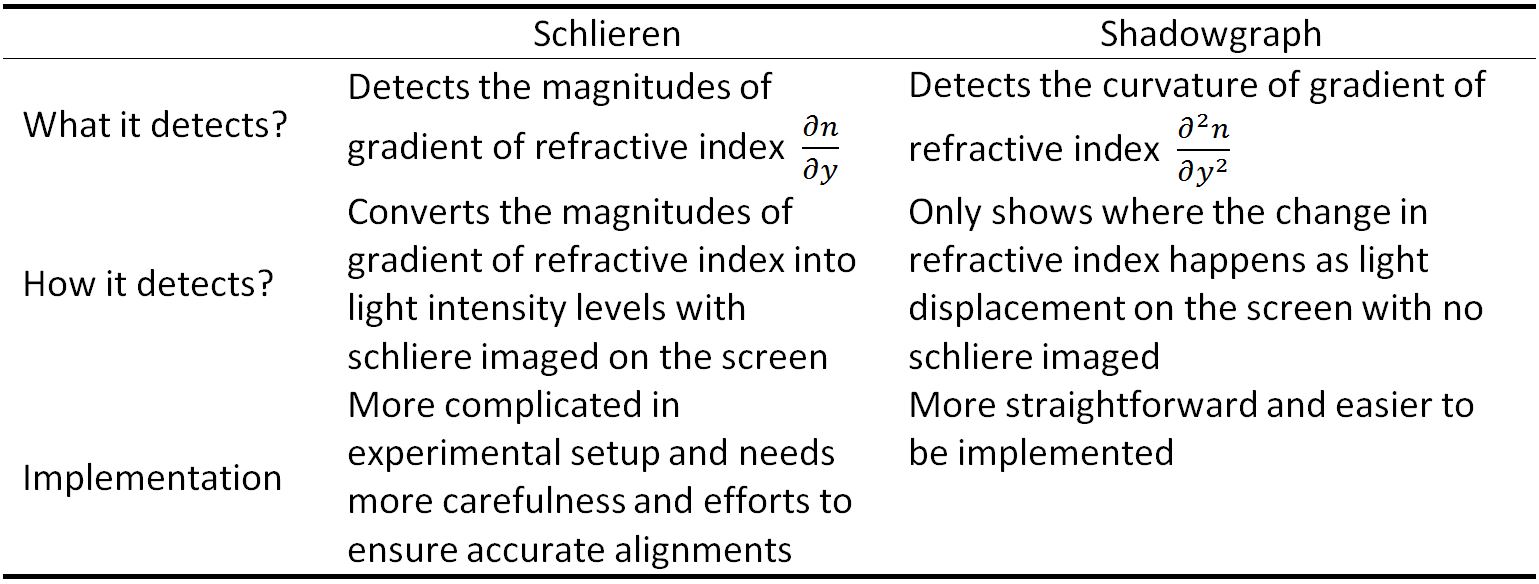
Pros and Cons
The comparison of two optical methods is summarised in Table 1.
Application in streamer studies
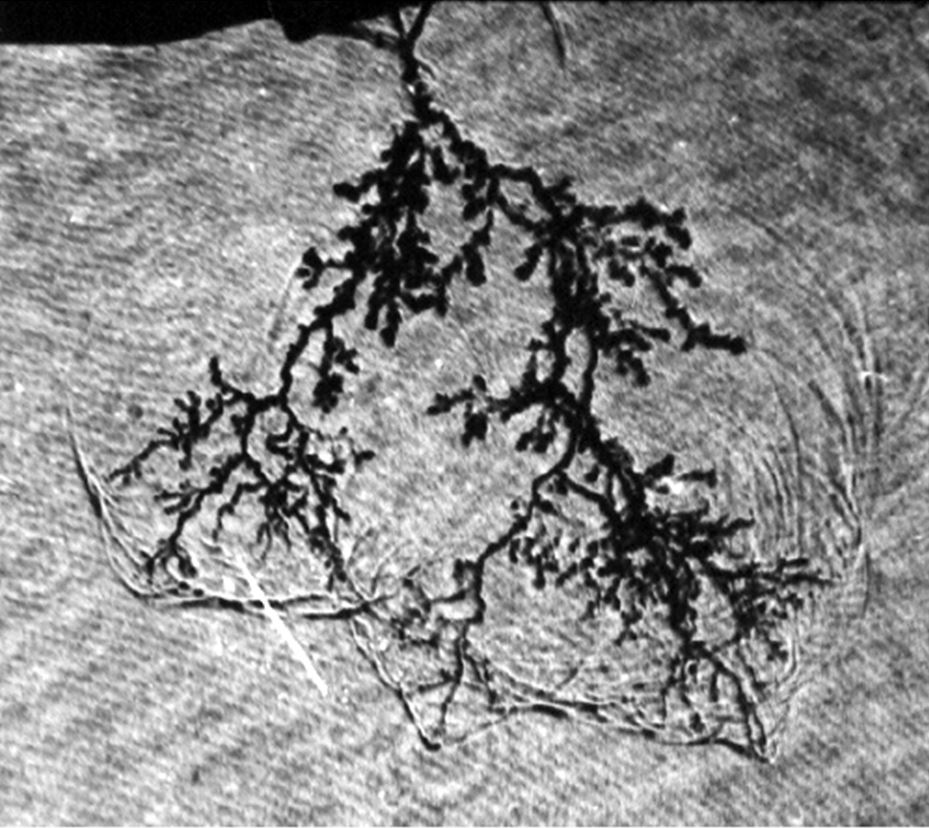
A large amount of streamer studies have been made with attempts to capture streamer propagation by optical methods since 1960s. Due to the limitations of the camera and light, high quality photos of streamer were not achieved until last decades. Figure 3 shows a gif example of streamer propagation in a 10 mm needle-plane gap under 36 kV positive lightning impulse. Captured by a high-speed camera, streamer initiation from the needle tip and its propagation to the opposite electrode are clearly registered. The streamer propagates with multiple main branches expanding into the radial direction with many offshoots in an average velocity of 2 km/s. The propagation from needle tip to opposite electrode takes approximately 5 µs.

Since the early visualisations of streamer in dielectric liquids since 1970s, uncountable milestones of streamer characterisation have been achieved, including but not limited to:
- Fundamental facts of streamer have been characterised: stopping length; streamer area; average velocity and acceleration voltage;
- 4 modes of streamer propagation are identified, each with different streamer morphology;
- The application of fractal index analysis on streamer is facilitated;
- The influence of field uniformity on streamer structure is revealed;
- The effect of liquid composition and additives on pre-breakdown characteristics is investigated;
- The effect of particle contamination on pre-breakdown mechanism is verified;
- The different pre-breakdown and streamer behaviours under different waveforms are spotted;
- Gaseous nature of streamer channel is evidenced;
- Bubble theory of streamer initiation mechanism is validated;
- And so on…
Implementation of Laser
The advantage of Schlieren technique is the higher sensitivity to visualise minute density disturbances. The sensitivity is further maximised by a higher coherence of the laser light source. As a high-power, single-direction, highly coherent and monochromatic light, laser can reveal more detailed information during streamer development, the shockwaves.
The applications of shadowgraph and Schlieren methods on streamer studies have greatly deepened our understanding of liquid breakdown mechanisms.
Author: Mr. Shuhang Shen – The University of Manchester
References:
[1] J. Rienitz. Optical inhomogeneities: schlieren and shadowgraph methods in the seventeenth and eighteenth centuries. Endeavour, 21(2):77–81, 1997.
[2] B. Farazmand, “Study of electric breakdown of liquid dielectrics using Schlieren optical techniques,” British Journal of Applied Physics, vol. 12, pp. 251-254, 1961/05 1961.
[3] G. S. Settles. Schlieren and Shadowgraph Techniques. Experimental fluid Mechanics. Springer, Berlin, 2001.
[4] P. Rozga, “Influence of paper insulation on the prebreakdown phenomena in mineral oil under lightning impulse,” in IEEE Transactions on Dielectrics and Electrical Insulation, vol. 18, no. 3, pp. 720-727, June 2011.