Partial discharge (PD) detection is commonly used for power transformer diagnosis. During PD process, electromagnetic emission, acoustic emission and optical emission can be detected, associated with chemical traces left simultaneously such as hydrogen H2 which is an indicator in dissolved gas analysis (DGA). PD electric detection is the most popular approach since it is of high sensitivity, whereas electric detection is also susceptible to electromagnetic interference. Therefore, PD acoustic detection is also used associated with PD electric detection to improve the diagnosis accuracy. If both the electric detection and acoustic detection spot the PD-like pulses, it’s highly likely that the signals come from PD instead of being interference.
However, PD acoustic detection is conducted conventionally by deploying the piezoelectric transducer (PZT) mounted on the transformer oil tank. The problem of conventional PD detection, as concluded in IEEE Std.C57.127, is that the PD acoustic emissions generated within the winding and the core cannot be effectively detected by the PZT mounted outside the tank. This greatly compromises the value of PD acoustic detection since over half of the transformer faults are related to the winding and the core, as reported in CIGRE A2.37.
Fiber optic sensors become popular in power grid monitoring because it is invulnerable to electromagnetic interference in high voltage applications and compatible to insulation which makes it deployable within the power equipment. Therefore, we envisage that the fiber optic sensors embedded within the power transformer can be used to improve the efficiency of partial discharge acoustic detection. To demonstrate this, we built an optic fiber acoustic sensor system (OFS) based on Sagnac interferometer, and compare its performance to an off-the-shelf PZT sensor system, i.e. a PZT (R15α) connected to an amplifier (Mistras) purchased from Physical Acoustic Corporation.
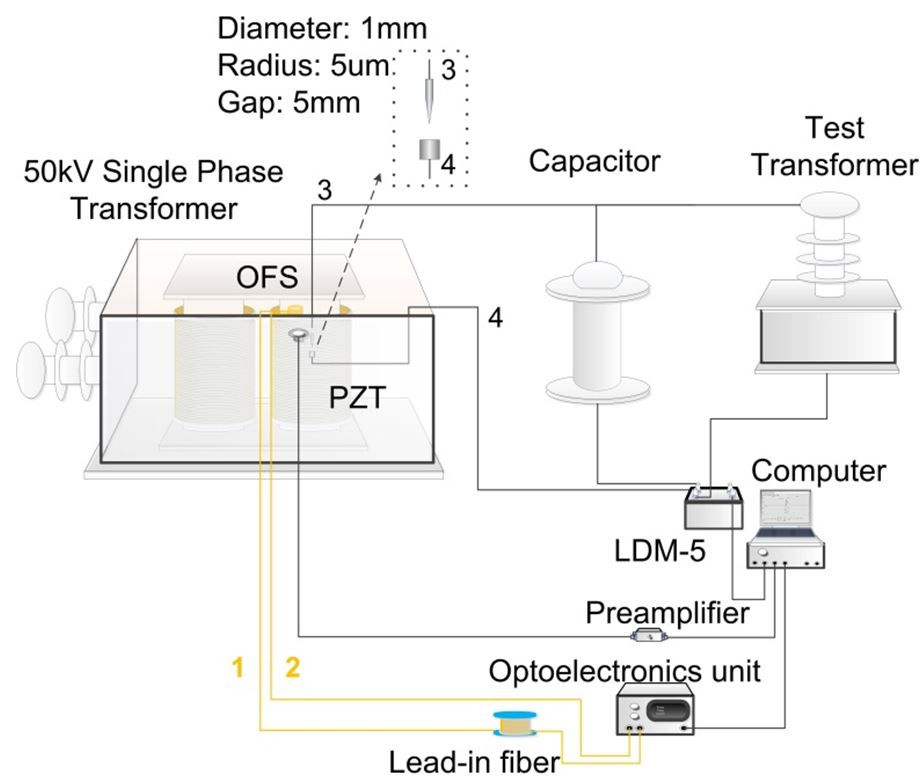
As shown in Figure 1, a 50 kV single phase transformer of 960 mm in length, 820 mm in width and 1018 mm in height was used as the model. The PZT was mounted on the outside surface tank by a magnetic clamp. Acoustic couplant was scrabbled on the outside surface of the oil tank in order to improve the acoustic coupling efficiency. The OFS was deployed on top of the winding. A capacitive coupling unit (LDM-5, Doble Engineering) was used to collect the electric signal as the reference.
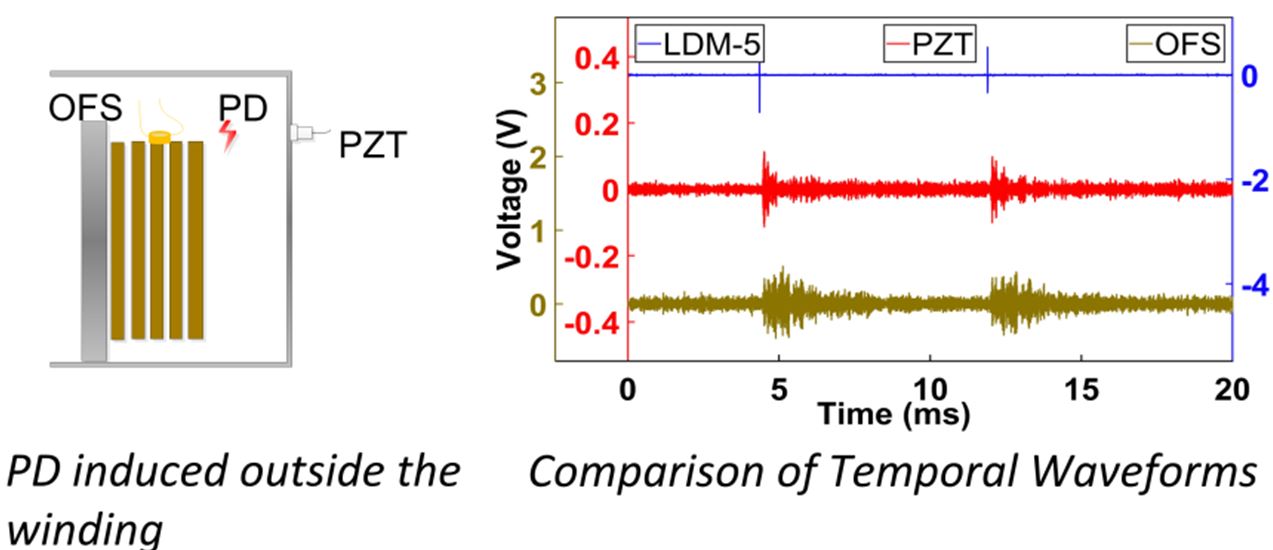
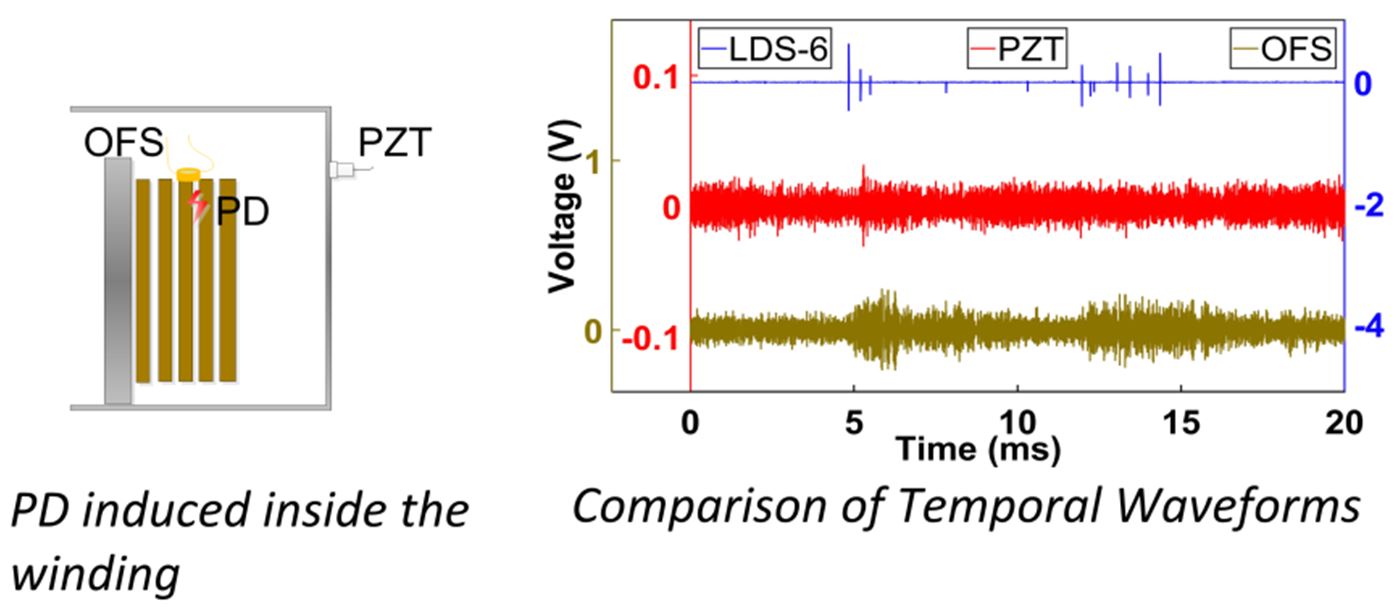
We first induced the PD outside the winding and inside the winding respectively to investigate the detection efficiency of OFS and PZT. As shown in Figure 2, both the OFS and PZT can effectively detect the PD in oil outside the winding. The temporal waveforms of OFS and PZT were slightly different. The waveform of PZT was in pulse shape, whereas the waveform of OFS was in wave packet. In contrast, acoustic emissions can be only determined in the temporal waveform captured by OFS if PD was induced inside the winding, whereas PZT didn’t capture clear PD acoustic emission in this case.
Since it was difficult to manually control the center frequency of PD acoustic pulse, we used an acoustic emitter to emit acoustic pulses of different center frequencies to investigate the frequency dependent performance of OFS and PZT for PD detection. Specifically, pulses of different amplitudes modulated by different frequencies were applied onto the acoustic emitter to emit acoustic pulses. The minimum detectable applied voltage was the voltage level at which the OFS or PZT captured the pulse signals of amplitude twice the noise level, i.e. signal to noise ratio (SNR) being 2. Therefore, lower minimum detectable applied voltage means better sensitivity, and ratio higher than 0 dB means that OFS outperformed PZT.
The results show that the OFS and the PZT have their own outperforming frequency span. OFS performed better at lower frequency span, whereas PZT performed better at its resonance frequency span from 130 kHz ~ 170 kHz. Figure 4 (c) and (d) show the comparisons between the temporal waveforms and power spectral density of signal to noise ratio of OFS and PZT at 150 kHz. The signal to noise ratio of PZT was approximately three times of the OFS.
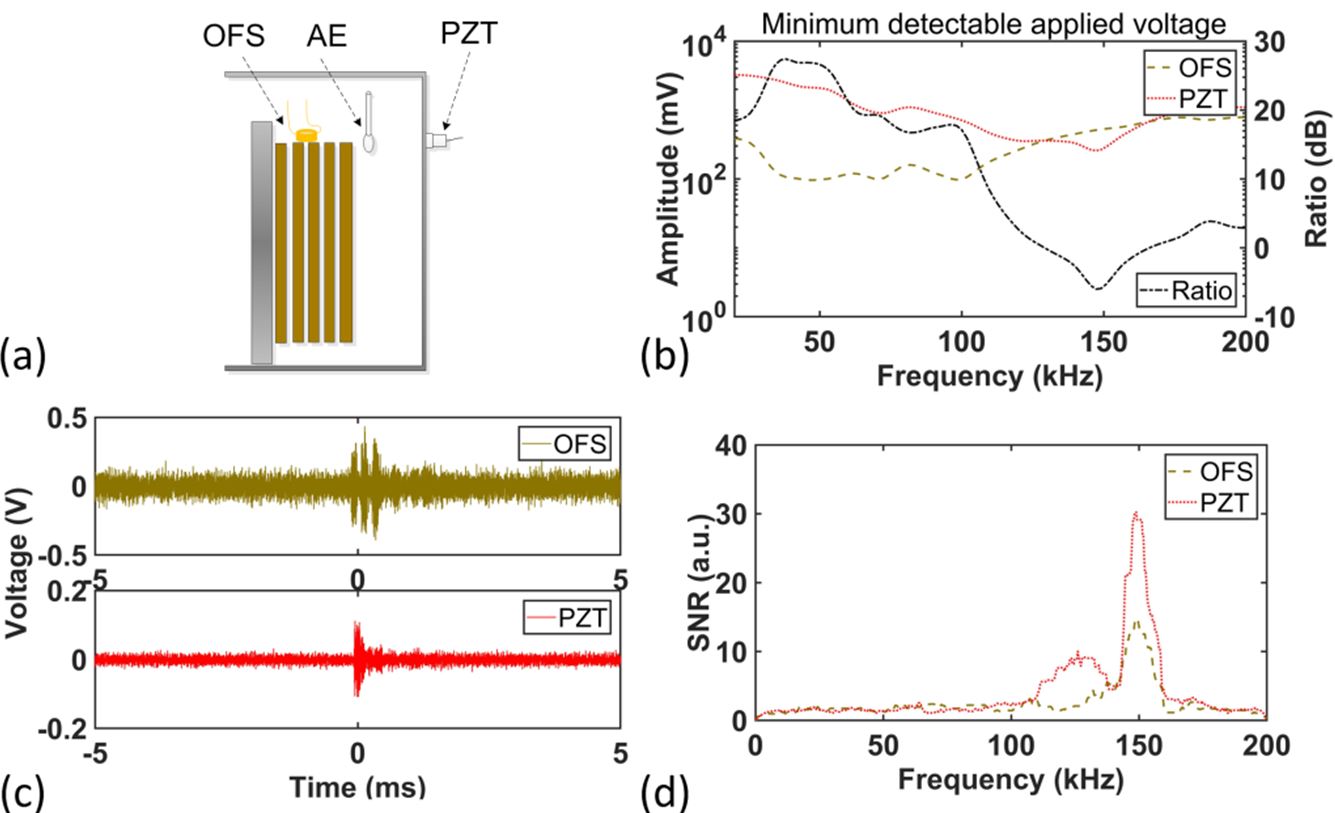
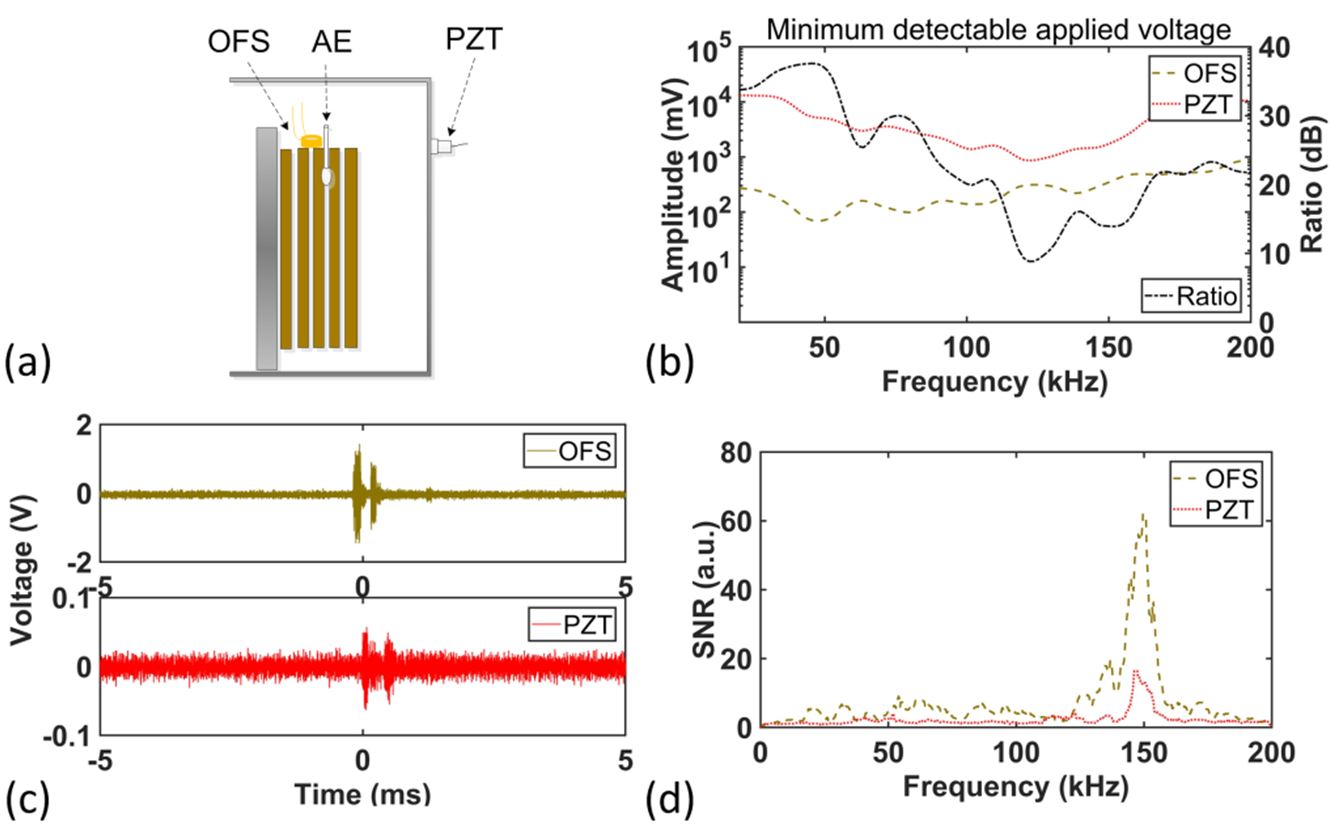
The scenario was different if the acoustic emitter was placed inside the winding. In this case, the OFS absolutely outperformed PZT at frequency span from 20 kHz to 200 kHz. The minimum of the SNR ratio of OFS to PZT was 7 dB at 130 kHz and approximately 40 dB at 50 kHz.
The results prove that the OFS deployed inside the power transformer tank can greatly improve the PD acoustic detection efficiency, since the sensors are closer to the signal sources. In summary, the results prove that fiber optic sensor deployed inside the transformer, in combination with its current applications in temperature and vibration monitoring, is supposed able to detect the PD acoustics inside the winding and therefore enlarge the PD acoustic detection zone.